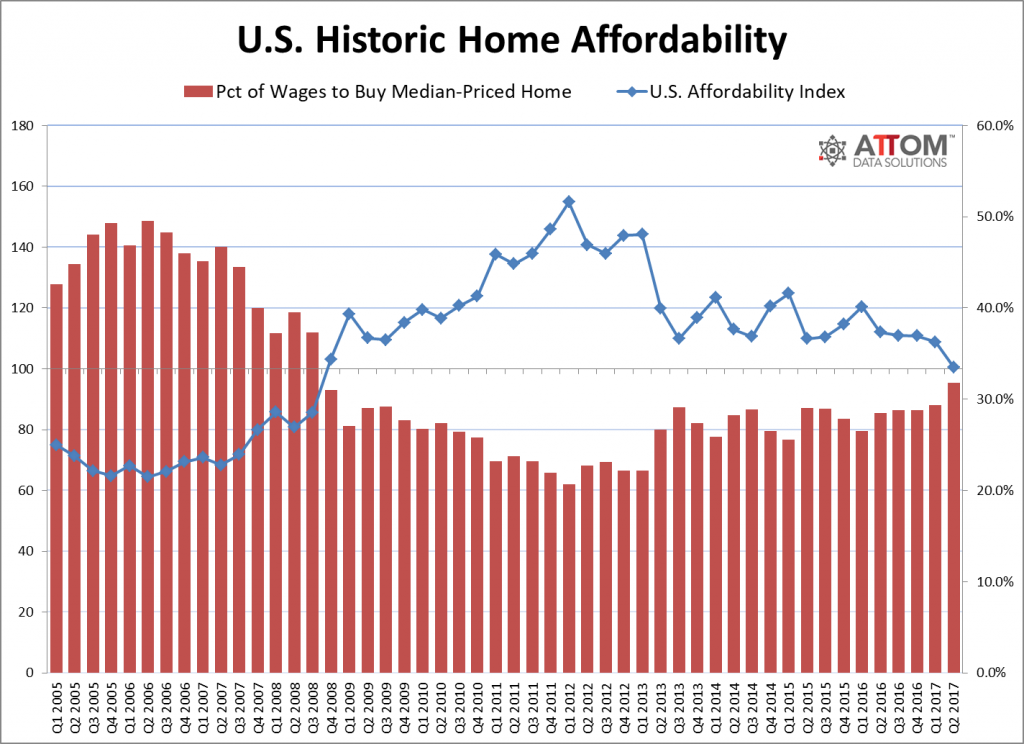
The U.S. affordability index dropped to 100 in the second quarter of 2017, which is the least affordable level since the third quarter of 2008, according to a new report from ATTOM Data Solutions.
The affordability index measures the share of average wages needed to buy a median-priced home nationwide. An index under 100 shows that affordability is less than the historic average.
Additionally, the report found that 45 percent the 464 U.S. counties analyzed were less affordable than their historic affordability norms, which is the highest share of markets less affordable than historic norms since the fourth quarter of 2009.
The combination of rising median home sales prices without growth in weekly wages has led to low affordability across the country.
Nationally, the median home sale price is up 7.7 percent in Q2 2017 compared to a year ago to $253,000, which is the biggest annual increase since Q1 2014. However, the national average weekly wage was $1,067 in Q4 2016, according to the latest information available by the Bureau of Labor Statistics, is down 1.4 percent compared to a year ago, which is the biggest annual decrease since Q4 2011.
“That combination of accelerating home price growth and slowing wage growth, along with mortgage interest rates that are up nearly 50 basis points from a year ago, eroded home affordability nationwide to the lowest level in nearly nine years, and pushed the highest share of markets beyond the threshold of normal affordability in nearly eight years,” said Daren Blomquist, senior vice president at ATTOM Data Solutions.
Affordability drops across Atlanta
The vast majority of counties throughout Atlanta saw a drop in affordability. The largest drop in affordability year-over-year occurred in Clayton County, which dropped from 142 to 118. However, it is also the only county in Atlanta to currently have an affordability index above 100. Dekalb County is the only county that saw a rise in affordability due to it being one of the few counties to show an increase in weekly wage growth without an increase in median home prices.
| County | % of Annualized Wages to Buy | Q2 2017 Affordability Index | Q2 2016 Affordability Index | Q2 2017 Median Sales Price | YoY Avg Weekly Wage Growth | YoY Median Home Price Growth |
| Clayton | 11.5% | 118 | 142 | $81,000 | 5% | 17% |
| Cobb | 29.4% | 94 | 96 | $227,750 | -2% | 3% |
| Dekalb | 26.0% | 83 | 79 | $189,900 | 2% | 0% |
| Fayette | 47.8% | 92 | 99 | $265,000 | -1% | 4% |
| Fulton | 27.6% | 85 | 89 | $270,000 | -1% | 5% |
| Gwinnett | 31.0% | 89 | 99 | $210,000 | -2% | 8% |
| Henry | 31.70% | 97 | 102 | $153,000 | -2% | 7% |
| Paulding | 35.40% | 90 | 101 | $166,450 | -2% | 11% |


