By the Numbers
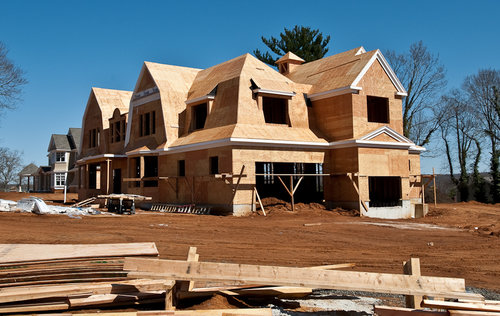
Single-family housing starts were up 4.2% from April and 49.8% from May 2020, at 1,098,000, according to the U.S. Census Bureau and Department of Housing and Urban Development.
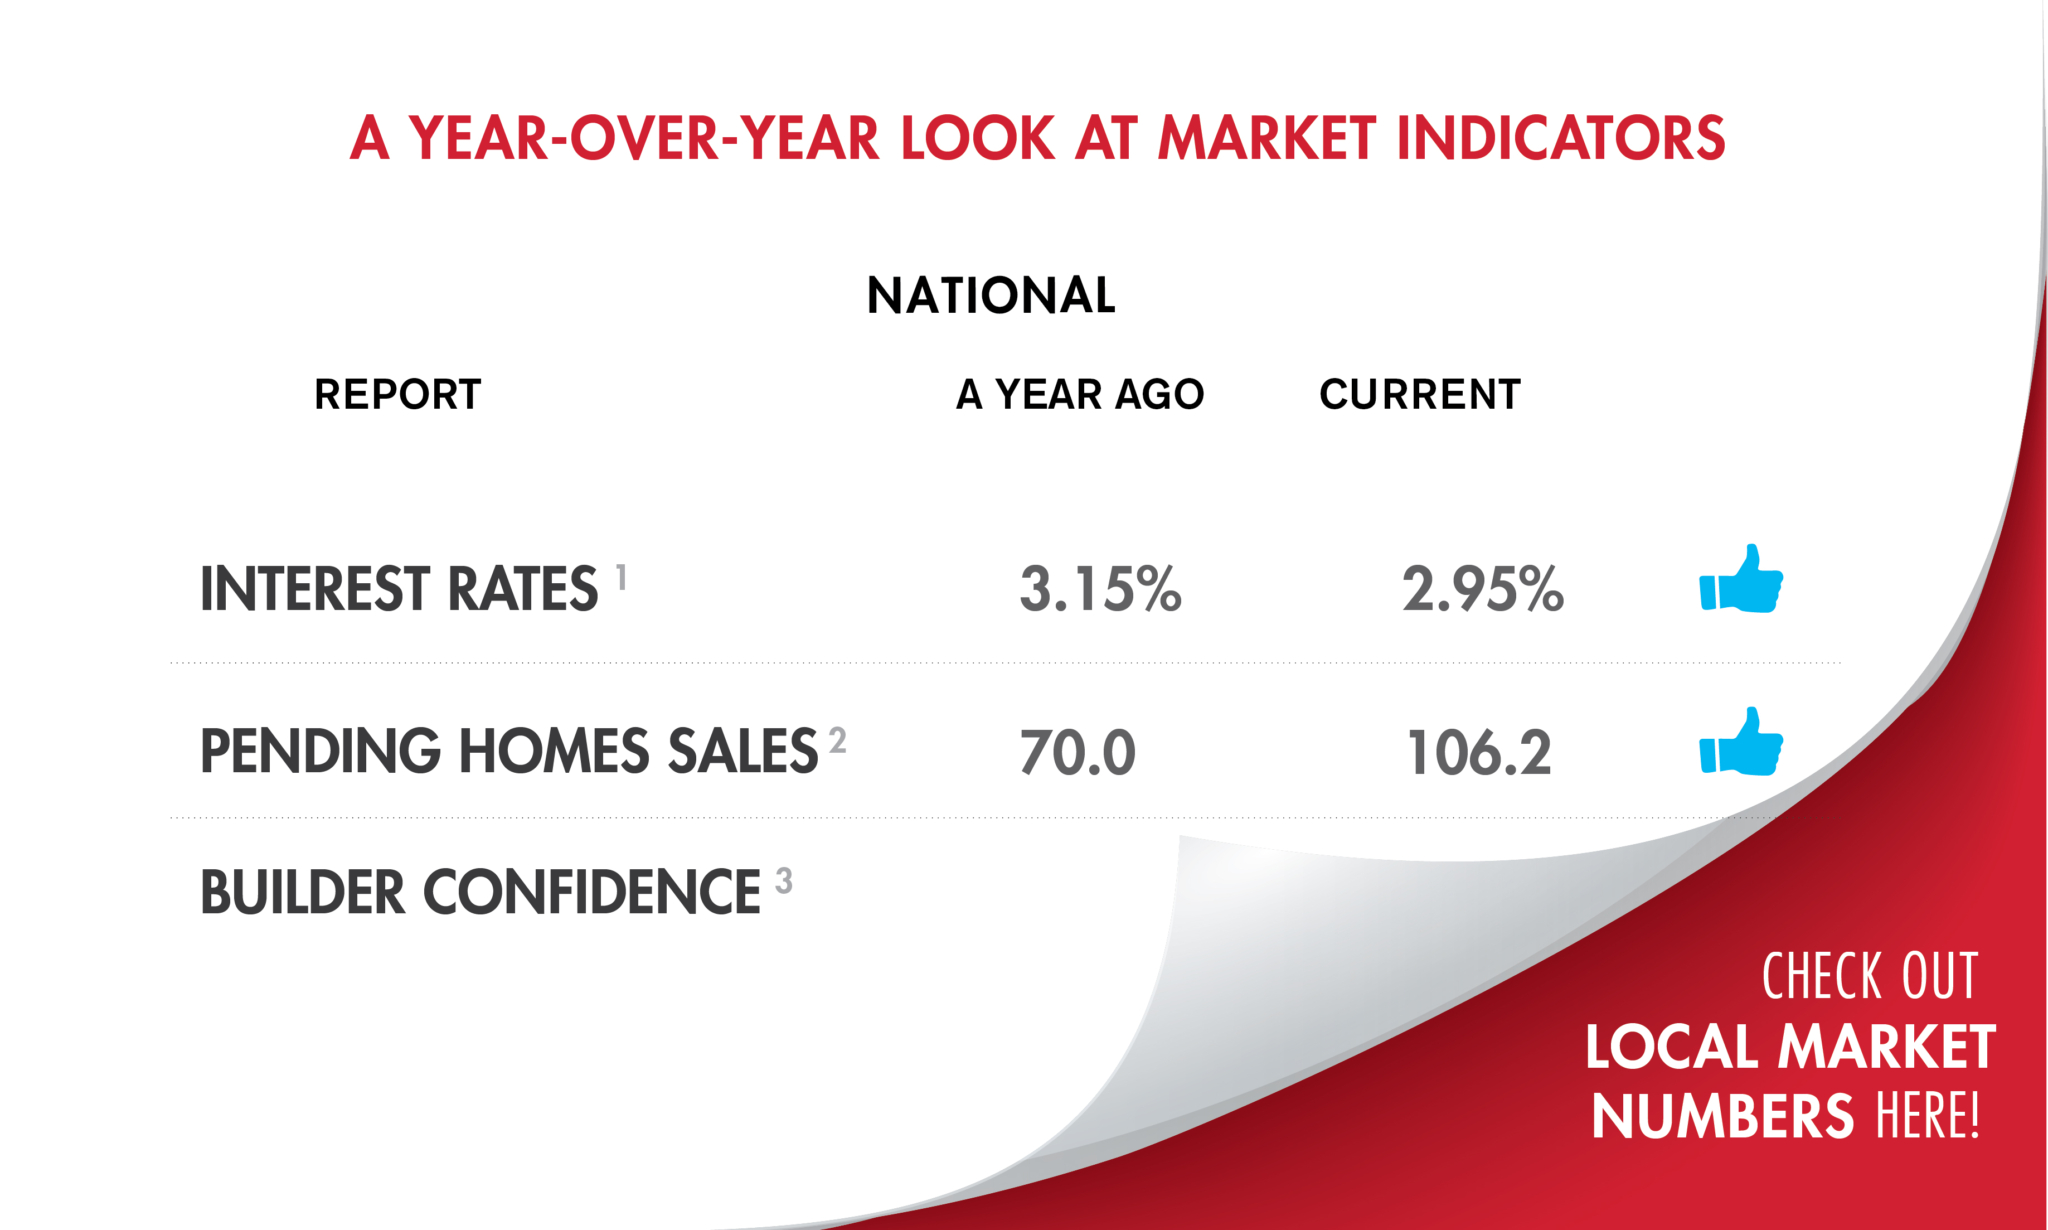
While pending sales are up 29% year over year, they are starting to slow and have fallen 9.7% from their peak.

Increasing costs and the declining availability of key building materials dampened builder sentiment, as higher costs have pushed some new homes beyond the budget of prospective buyers.

Expert panelists from Zillow’s Home Price Expectations Survey say if changes aren’t made, new construction growth will stall, home prices will continue to increase, and less of today’s 30-somethings will have the ability to own a home.

Despite the monthly increase, listings stayed near all-time lows, down 59.8% from 15,281 listings in May 2020.
Housing inventory, meanwhile, remained significantly below year-ago levels in May.

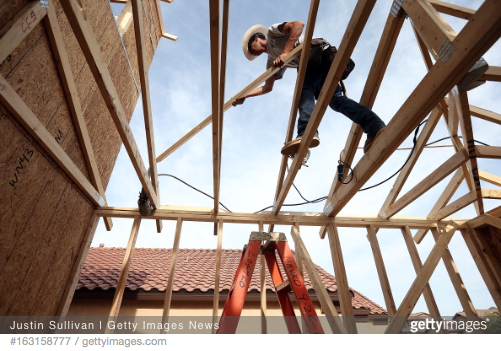
Longer-commute areas continued to claim the largest market share in single-family homebuilding, but the construction growth rate was strongest in places with shorter commuting times, the National Association of Home Builders said, citing its quarterly Home Building Geography Index.
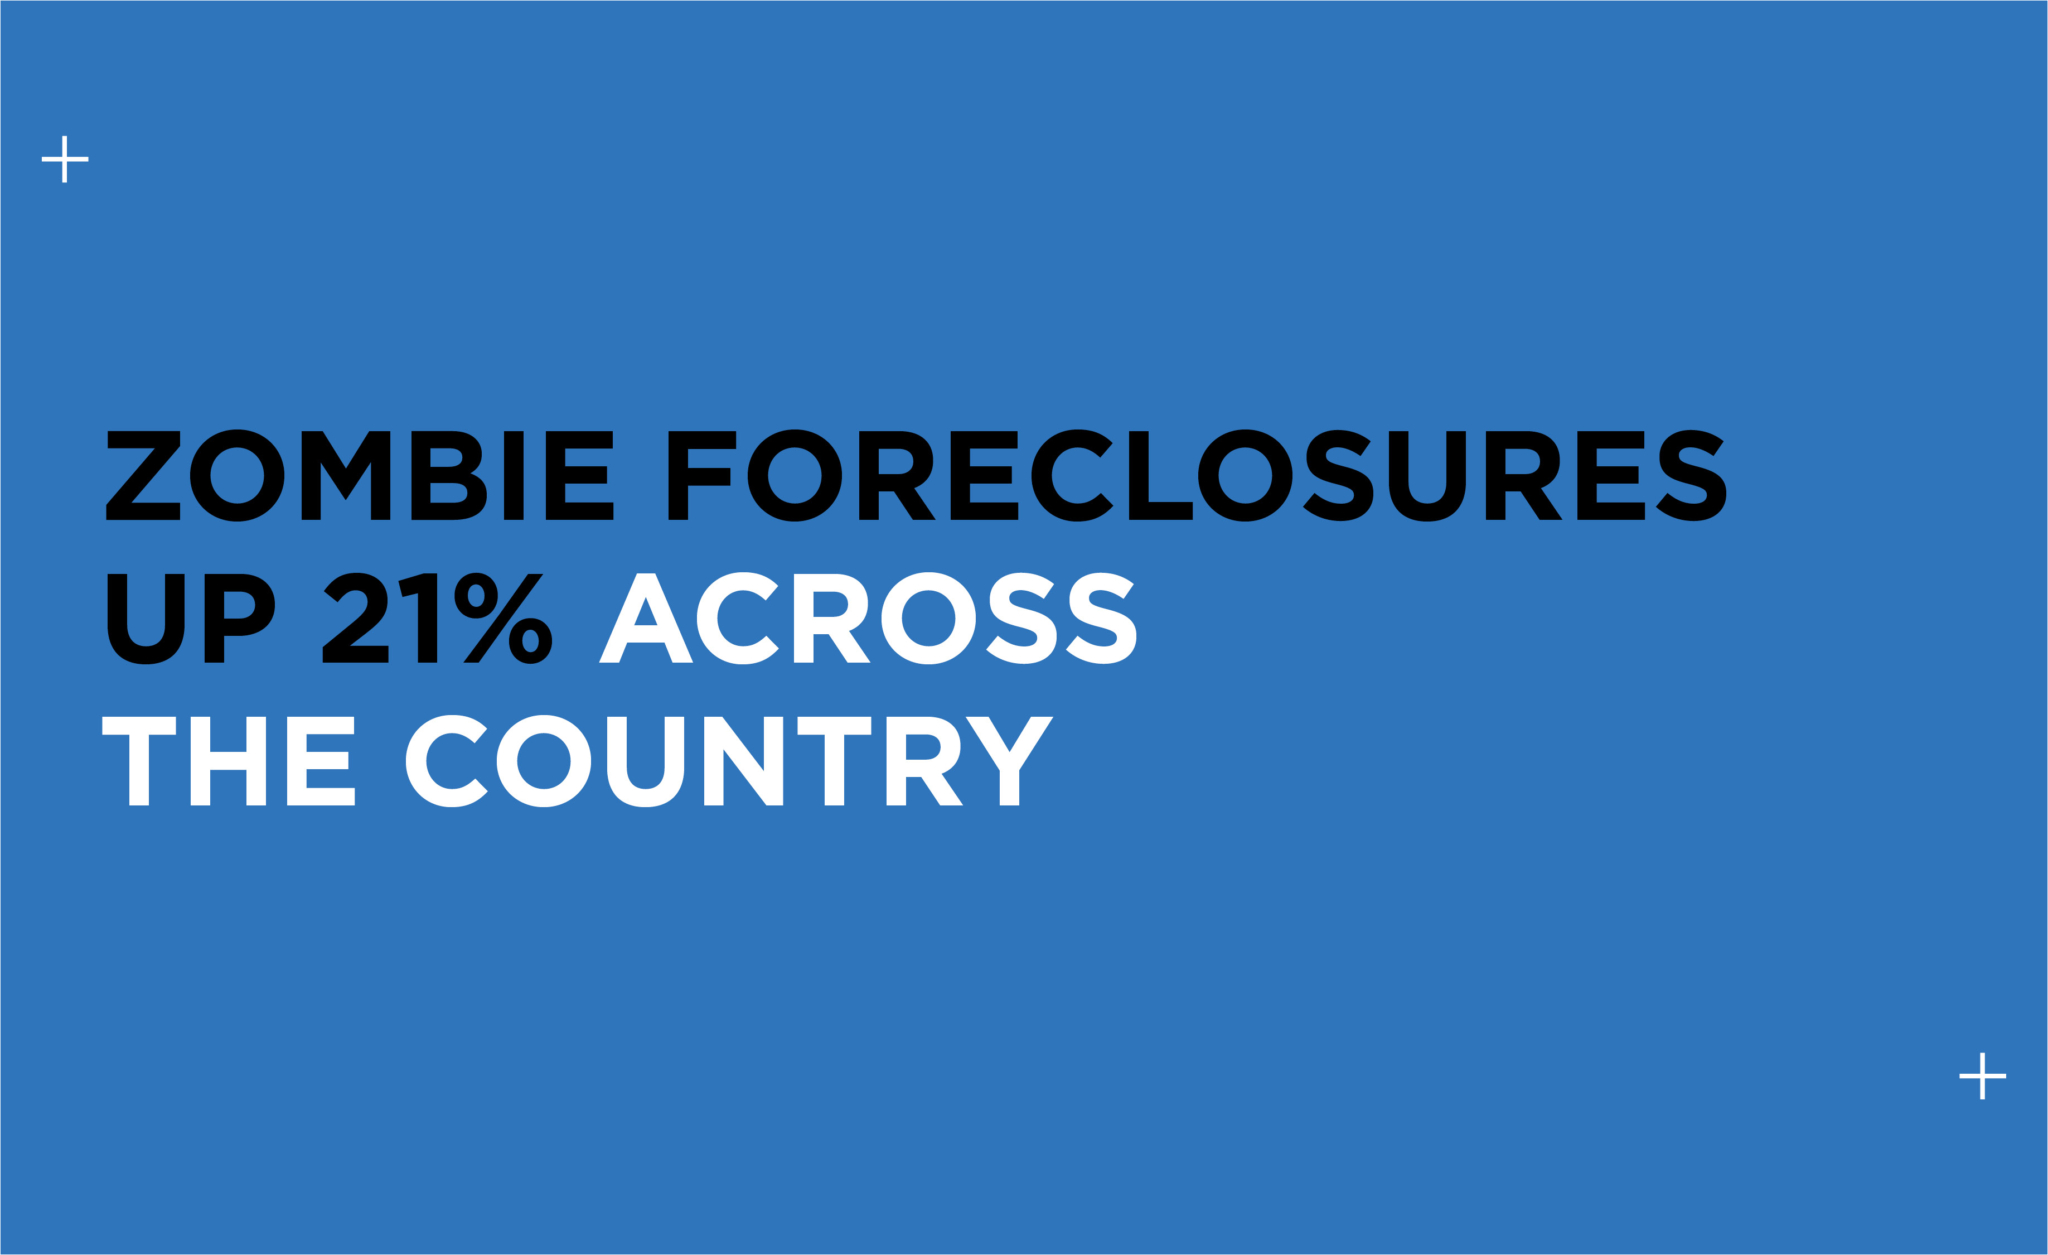
Of the 99 million residential properties in the U.S., approximately 1.4 million (or 1.4%) are vacant this quarter, with “zombie” home rates increasing both quarterly (21%) and annually (5.6%).
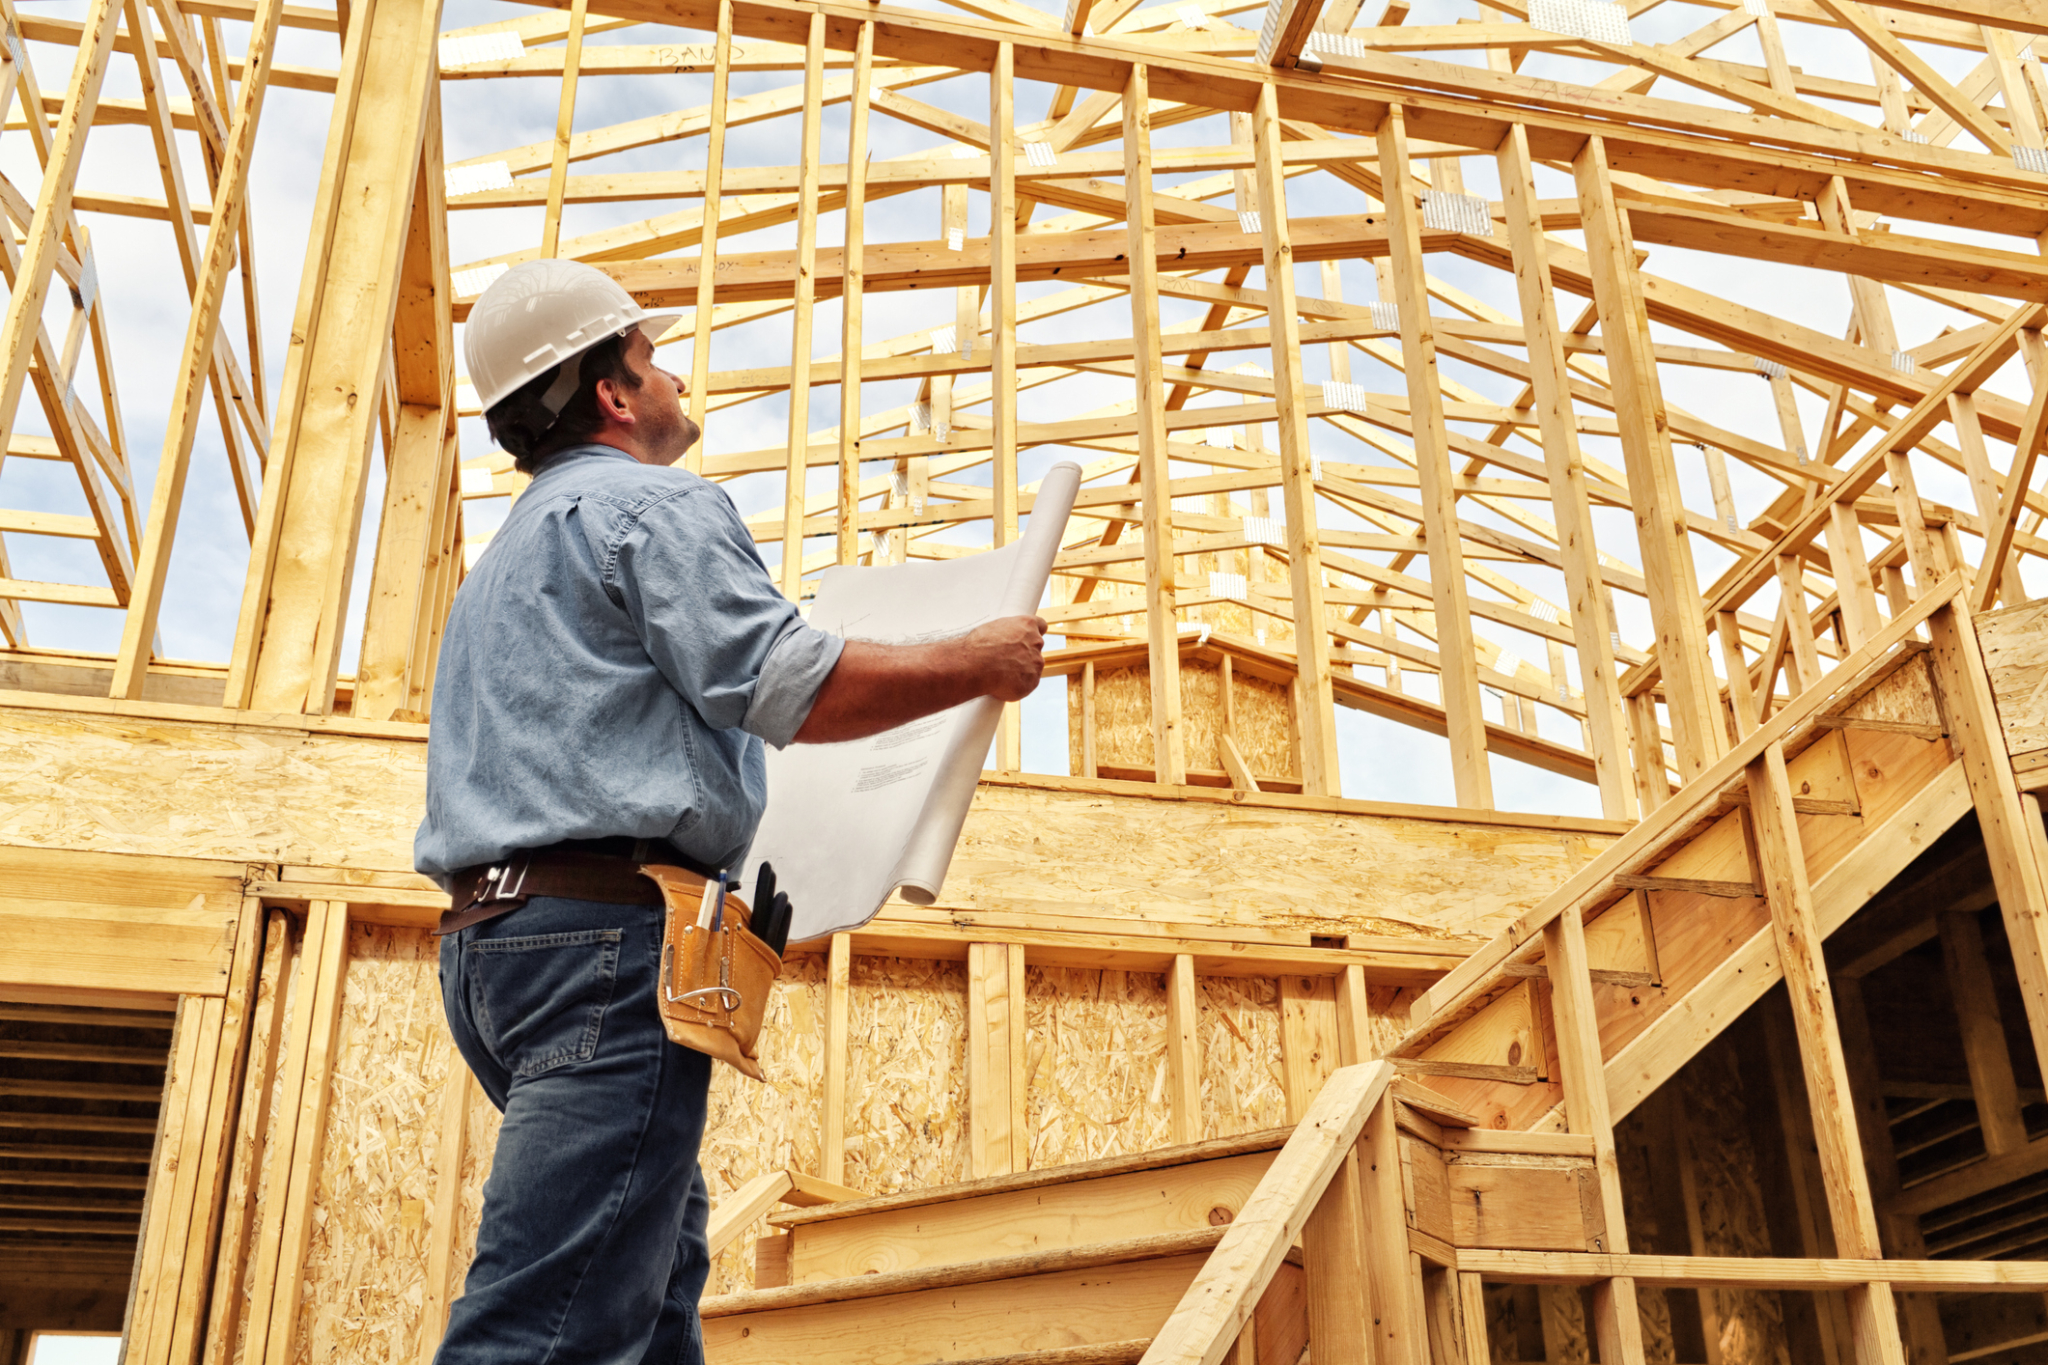
Special questions added to the National Association of Home Builders’ monthly builder survey found 90% or more of respondents had experienced shortages of plywood, oriented strand board, framing lumber and appliances, with most other materials also hard to come by.
Year over year, however, pending home sales were up 57.1%, the NAR said, citing its monthly Pending Home Sales Index.

“Demand is robust throughout the country, but homebuyers continue to be held back by the lack of homes for sale and rapidly increasing home prices.” — MBA Associate Vice President of Economic and Industry Forecasting Joel Kan
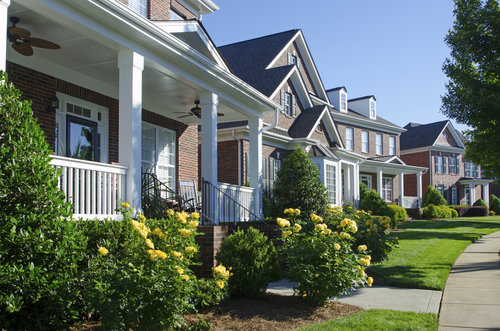
The median sales price of new homes sold in April was $372,400, up from $334,200 in March and $310,100 a year ago.
Nationwide, the seasonally adjusted housing index rose 2% month over month in February and 13.2% year over year, up from a monthly increase of 1.2% in February.

Housing records continue to be broken, but despite the strong numbers, data could indicate homebuyer demand is reaching a peak.

Higher income, backed up by lower mortgage rates, has expanded the reach of the average homebuyer, but an increased demand for homes has concurrently driven up prices, negating two of the three main factors in First American Financial Corp.’s Real House Price Index.

The short supply continued to drive increases in the price of homes, with the median existing-home price for all housing types rising 19.1% year over year to $341,600.