Median list prices declined 2.4% nationwide to $429,500 in May, representing the seventh-straight month of year-over-year decreases and the largest annual drop since 2017, according to the latest Monthly Housing Trends Report from Realtor.com.
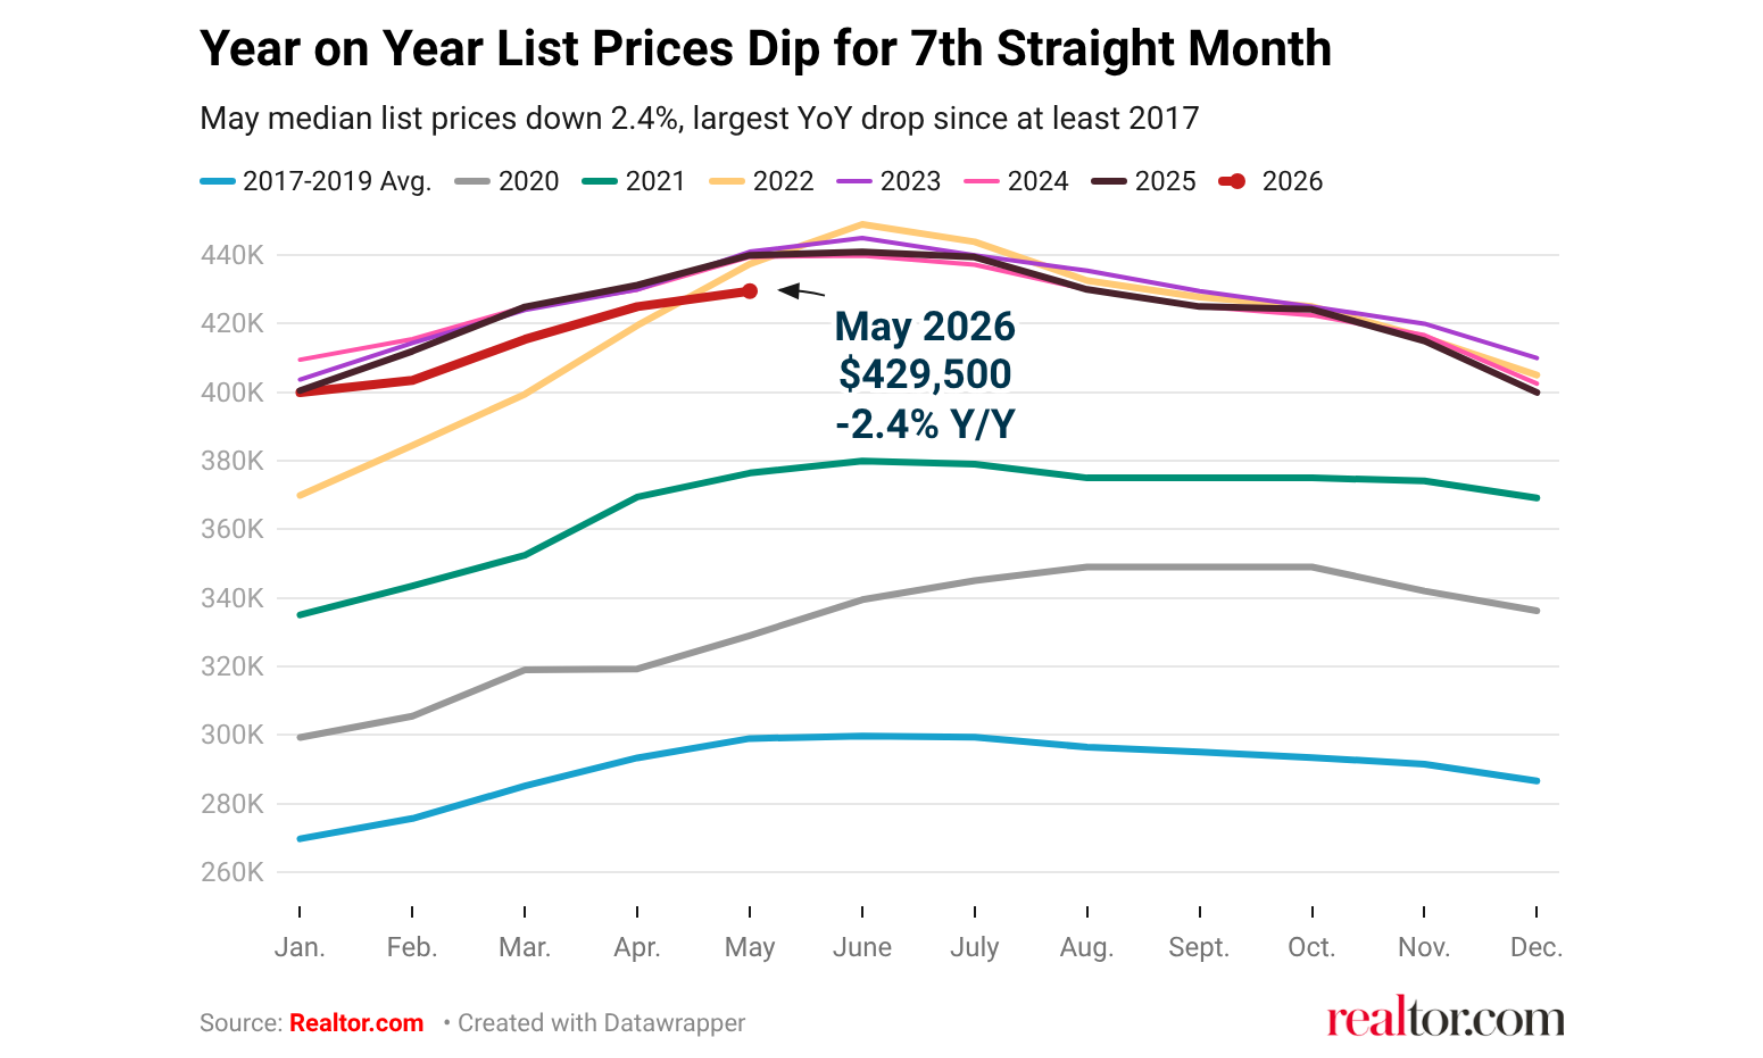
The median listing price fell for the seventh-straight month, according to the May Monthly Housing Trends Report from Realtor.com.
That median list price equated to a median price per square foot of $228, down 2.5% from May 2025 — a record annual decline.
Meanwhile, new listings hit a four-year high of 474,976 and pending sales increased for the sixth month straight.
Amid what Realtor.com called the most active spring market in years, Chief Economist Danielle Hale said the market is finding a new equilibrium.
“Higher rates and geopolitical uncertainty could have sidelined both buyers and sellers this spring,” said Hale. “Instead, we’ve seen six months of sellers adjusting their expectations and buyers rewarding them for it. List prices are down at a record pace, but price reductions are also down. That combination tells you sellers are doing their homework before listing, not after.”
The share of active listings with a prior price reduction decreased 1.6 percentage points to 17.5%.
“In a crashing market, sellers list optimistically and get forced to cut. What we’re seeing is different in a key way,” said Senior Economist Jake Krimmel. “Sellers are using current market conditions as price discovery from the start, pricing for current conditions rather than selling under distress. That combination tells you sellers have internalized the more buyer-friendly conditions and are adjusting price expectations before listing rather than after. This is a meaningful behavioral shift, and it’s precisely why buyers are still showing up despite rates above 6.5%.”
Regional price changes and listing activity
The median list price decreased annually in all four major United States regions in May: 4% in the West, 2.5% in the South, 1.8% in the Northeast and 1.2% in the Midwest.
Price per square foot declined most in Austin, Texas (down 8.3%), Memphis, Tennessee (down 5.9%), and Buffalo, New York (down 5.8%), but increased most in Providence, Rhode Island (up 9.1%), Indianapolis (up 5%), and Cleveland (up 3.1%).
Amid price decreases, new listings increased 8.6% in the Northeast, 4.7% in the Midwest and 0.6% in the South, but declined 1.4% in the West.
In the Atlanta metro area, sellers pulled back, with new listings declining 6.1% and the median list price increasing 1.2% year over year to $425,000.
At the same time, the price-reduced share decreased 2.9 percentage points to 20.4%.