
Household debt decreased yet again in the third quarter, according to data from the Federal Reserve.
The Federal Reserve yesterday released its third quarter study of household debt, showing that households continued to decrease their debts following the stock market crash of 2008.
Using two measures to track debt – the household debt service ratio (DSR) and the financial obligations ratio (FOR) – the Fed looked at the finances of both renters and homeowners, analyzing what percentages of each group’s income are devoted to various debt obligations.
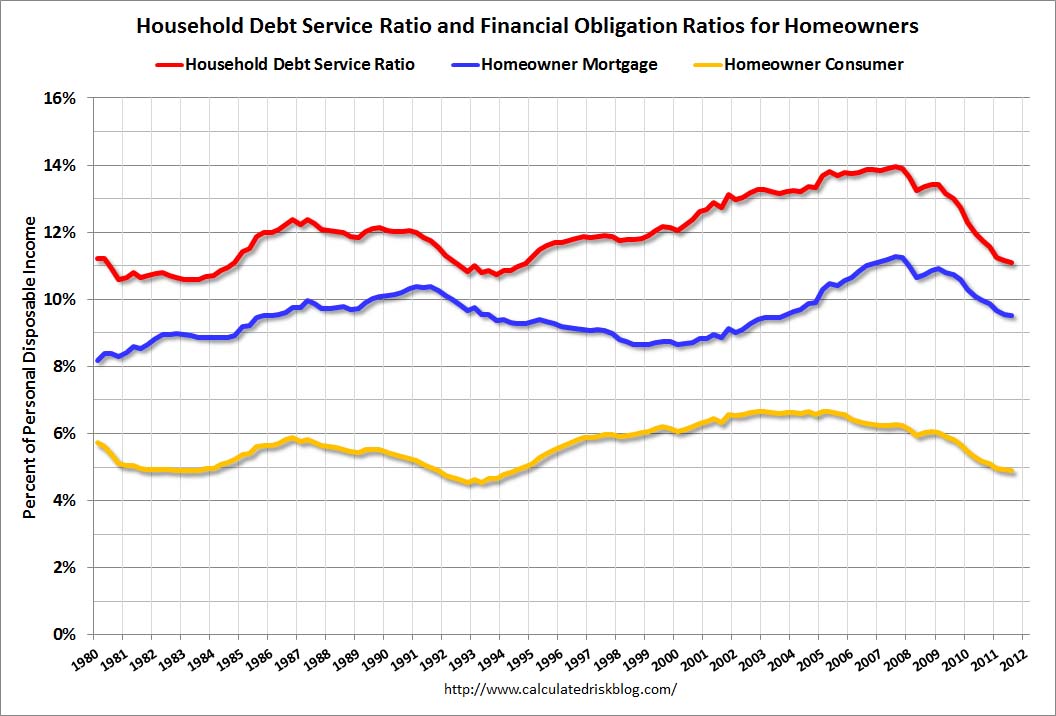
The DSR serves as an overall survey of debt, tracking the estimated ratio of debt payments (for outstanding mortgage and consumer debt) to disposable personal income. So for the 2011 third quarter, the DSR was 11.09, meaning just over 11 percent of consumer’s disposable income went to the service of the aforementioned debts. Though it may seem high, it’s a substantial decrease from its 2007 high point, when it reached 13.96 in the third quarter.
The FOR, which covers both mortgage debts (and includes homeowners payments on mortgage debt, homeowner’s insurance and property taxes) and homeowner consumer debts (which includes payments on consumer debts and automobile leases), has been similarly declining since 2007.
The 2011 third quarter FOR was 9.53 for mortgage debts and 6.25 for consumer debts, totaling 14.42 in total debt. As with the DSR, the most recent highs for the data were in the third quarter of 2007, when mortgage debt was at 11.30, consumer debt at 6.25 and the total debt load at 17.55.
Bill McBride, in a post on his Calculated Risk blog about the data, wrote that while the Fed admits to the limitations of the actual data, it is extremely useful in tracking the trends of household spending behavior.
Indeed, the Fed addressed those very shortcomings on its website for the data, stating, “The limitations of current sources of data make the calculation of the ratio especially difficult. The ideal data set for such a calculation would have the required payments on every loan held by every household in the United States. Such a data set is not available, and thus the calculated series is only a rough approximation of the current debt service ratio faced by households.”
For a graphical representation of the Fed’s data, see this graph from McBride’s post.